
Class III AVO (amplitude variation with offset) anomalies are widely recognised as hydrocarbon indicators, with the product of intercept (A) and gradient (B) often used as a direct fluid discriminator. This AB attribute successfully predicted gas-bearing sands at Well A, resulting in a commercial discovery. A follow-up well was proposed to target two zones both exhibiting strong Class III anomalies in the AB attribute. However, the drilling results revealed that while the upper interval did indeed contain hydrocarbons, the lower interval consisted of high-porosity brine sands adjacent to thin coal layers. Well logs and synthetics confirmed that both geological scenarios can yield strong AB anomalies, thus complicating fluid prediction.
We propose two new frequency-sensitive diagnostics to enhance AVO analysis, namely, the Frequency Stability Index (FSI), which measures the stability of AB across frequencies, and the slope of AB versus frequency respectively, which captures its overall trend. Application to both real and synthetic data from one case study demonstrates how the hydrocarbon-bearing sands can be differentiated from coal beds and brine-sands using frequency-dependent attributes and their crossplots. This workflow offers a practical and quantitative method for improving fluid prediction in exploration and appraisal settings.
Introduction
Amplitude variation with offset (AVO) is a foundational technique in quantitative seismic interpretation, with Class III anomalies, defined by a negative intercept and a strong negative gradient, commonly linked with gas sands (Shuey, 1985; Rutherford and Williams, 1989). Among the various AVO-derived attributes, the product of intercept (A) and gradient (B), known as the AB product, has proven particularly effective for delineating hydrocarbon-bearing sands (Fatti et al., 1994; Castagna and Swan, 1997).
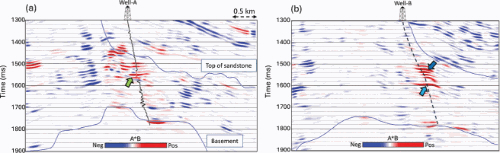
In our study area, the AB attribute initially demonstrated promising predictive value. At Well A, a strong Class III AB anomaly successfully identified gas-bearing sands, which were later confirmed by drilling (Figure 1a). Encouraged by this result, a nearby prospect was drilled at Well B, targeting two intervals that both exhibited pronounced Class III AB anomalies (Figure 1b). However, post-drill results revealed an important limitation: while the upper anomaly corresponded to hydrocarbons, the lower anomaly was associated with high-porosity brine sands adjacent to thin coal beds. Synthetic modelling and log analysis confirmed that both scenarios can generate similar Class III responses, underscoring the risk of relying on AB attribute alone for hydrocarbon discrimination (Figure 2).

