
This paper won the 2026 Nigel Anstey Award for Best Paper published in First Break last year.
Abstract
We conducted a feasibility study on the processing of converted PS waves for an OBN (ocean bottom node) acquisition parameterised for PP data only. The PS seismic data was preconditioned and prepared as input for tomographic iterations to update the Vs velocity. Available geotechnical measurements were combined with an empirical model to construct the very shallow Vs velocity from the water bottom up to 200 m. From 200 m to the basement, the initial VS model was built using a predefined conversion pattern using the legacy PP velocity. After several tomographic steps, an initial set of images, migrated with Kirchhoff algorithm, presented several identifiable PS events in the PP volume. Refinements of Vs field, conducted by PP-PS correlation, improved the quality of PS data, mainly below the salt layer. Finally, partial stacks served as input data to a joint PP-PS elastic inversion test which resulted in a S impedance volume much closer to well data than the one derived from inversion of PP data only.
Introduction
The number of offshore multi-component seismic acquisitions has been growing in Brazil in the last 15 years due to the need to study increasingly complex areas (Cruz et al., 2021). Processing of compressional wavefield (PP) recorded in these seismic data has been evolving over time, mainly in the pre-migration processing and compressional wave velocity (Vp) model-building for imaging (Ristow et al., 2024). Seismic cubes with higher azimuthal richness and spectral bandwidth have been obtained, with an excellent quality of the velocity model due to the incorporation of the full waveform inversion (FWI) technique into the workflow (Jouno et al., 2019; Brando et al., 2023; Casado et al., 2024).

On the other hand, the processing of converted PS wavefield is still in its early stages, mainly due to the challenges of sampling this wavefield. The shear wave propagation velocity (Vs) is lower than Vp, which requires much denser acquisitions than the ones acquired nowadays (Davydenko et al., 2016), usually in the order of 500 x 500 m receiver grid. Properly sampling this wavefield in shallower portions is an even more challenging task (Gaiser, 2016). Seismic surveys with such density are impractical due to the high cost and operational issues such as limited battery time and the total number of available receivers.
Previous attempts at processing PS data in an offshore environment using Ocean Bottom Sensors have been successful, although with smaller receiver spacing and shallower water depths (Ata et al., 2013, D’Afonseca et al., 2014). We investigated the viability of processing converted wave signal in an OBN acquisition, with a receiver spacing (in this case, 500 m) that was optimised for the PP data. We selected the seismic data from a project in Santos Basin, Brazil, and applied the following processing steps: pre-processing, imaging, and Vs model building.
Seismic and well data
The survey is in Santos Basin, an Atlantic pull apart basin with three major stratigraphic sequences: Post-, Intra- and Pre-Salt, with reservoirs in the Pre-Salt sequence, offshore Brazil (Figure 1) (Formigli, 2008).
The OBN data was acquired in the years 2018/2019. This was a large-scale acquisition, with a receiver area of 1621 km² and 6602 receiver stations with 4 components: 1 hydrophone and 3 geophones. The receivers were arranged in a 500 x 500 m grid, and the shooting grid has a sampling of 50 x 50 m. We selected an area of 677 km² for this pilot processing project (red rectangle in Figure 2) and 3051 receivers for imaging this area. The water depth in the pilot area ranges from 1740 to 2030 m.
The processing of the PP wavefield was done previously, right after the completion of the acquisition, to obtain a precise, reliable and high-resolution full azimuth subsurface seismic image, especially in the pre-salt depth, allowing structural and stratigraphic interpretation and prospect evaluation. The pre-processing flow consisted of several important steps such as travel time inversion for node position, water velocity variation and residual clock drift; geophone reorientation; source ghost attenuation and wavefield separation (upgoing and downgoing). Regarding the PP velocity model building, the processing team built a TTI (transverse tilted anisotropy) model by applying the two main techniques available: tomography and FWI (full waveform inversion, from total wavefield) (Zhigang et al., 2018). The following iterations were performed:
- Water velocity update
- Post-salt tomography 1
- Post-salt FWI
- Post-salt tomography 2
- Top salt interpretation and salt flooding
- Intra-salt FWI and tomography
- Base of salt interpretation and initial pre salt model (gradient)
- Pre-salt tomography and FWI
The use of FWI in the velocity model-building was essential to create a model that is geologically consistent and matches the well data (sonic logs and tops). The final P-wave imaging data was generated by using both Kirchhoff and RTM 45 Hz algorithms. For imaging the converted PS wavefield, the Vp and anisotropic parameters were not updated. Furthermore, we used the upgoing wavefield migrated data when comparing PP and PS data, since it displays similar sampling problems to the ones of the converted wave data.
Auxiliary data for Vs model-building
We used auxiliary data for the initial Vs model building and quality control: well logs and Vs measurements in the shallow part from geotechnical wells.
There were 31 wells available in the pilot area at the time the project started. The conventional sonic logs were available for all of them, but only a few had the sonic dipole log acquired.
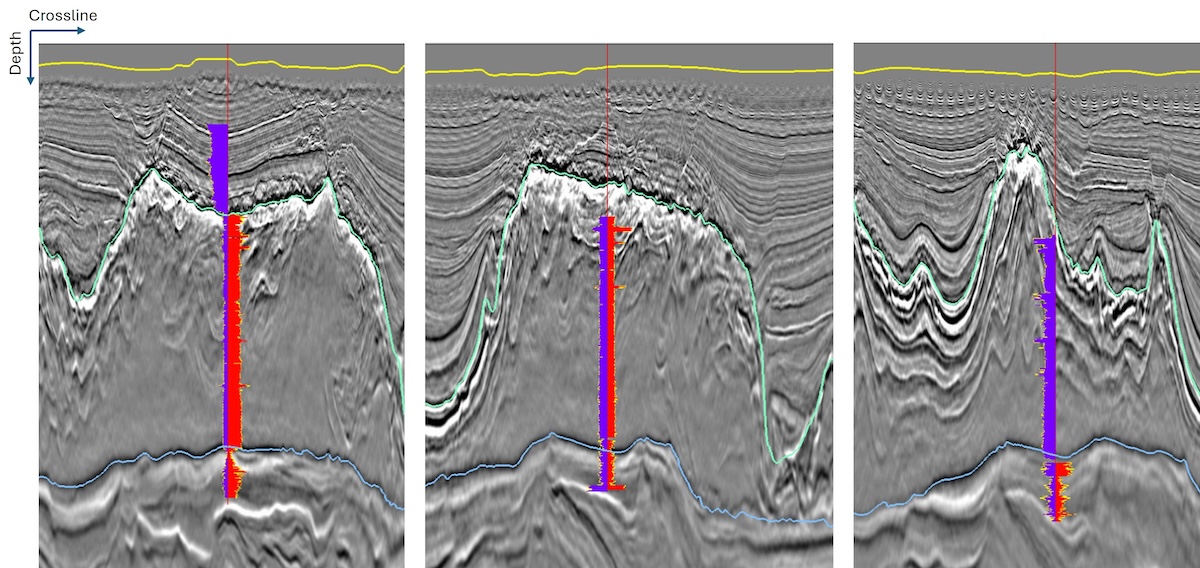
After an initial QC of the log data, we observed that the post-salt sedimentary sequence presented no data in most of the wells. Most of the wells had data only in the reservoir interval and some had information also in the salt dome areas, as illustrated in Figure 3. The lack of consistent information for shear-wave velocity in the entire interval was an issue for building and analysing the quality of the Vs model, mainly in the 0-500 m depth from the water bottom horizon.
The Vs measurements in the very shallow part (0 to 60 m) were crucial to define the shear velocity behaviour in the deeper section. In this shallow portion, Vs is very low and consequently, the Vp/Vs ratio can be anomalously high (values greater than 10 can be observed). There were eight profiles of geotechnical wells available in the full acquisition area but only two in the pilot area, as shown in Figure 4.
The geothecnical wells were acquired in 2022 (Baziw et al., 2017). The equipment used in this campaign is mounted with two hydraulic hammers in opposite horizontal directions on its stern foot to generate shear waves at the mudline. The seismic probe has two triaxial geophones mounted 1 m apart for recording the seismic signals.
The interval velocity is calculated by measuring the difference of shear wave arrival times between two geophones using the below formula,
where L2 and L1 are the assumed travel paths from mudline to the lower and upper geophones, respectively. The difference between these two geophones is fixed at 1 m and seismic data was acquired at a sampling rate of 0.25 miliseconds. The Vs profiles have a final spatial sampling of 3 m and maximum depth of 60 m, approximately. Results will be shown in the next section.
Preprocessing and velocity model-building
We applied the following pre-processing steps to prepare the seismic data for the shear velocity model-building with Kirchhoff imaging: noise attenuation, reorientation (Radial-Transverse), source deghosting, zero-phasing and bubble attenuation. The input data was the set of raw field data which contained calculated corrections (derived from the PP data) in its headers: receiver positioning, clock-drift, subsample, and water velocity correction. Therefore, these corrections were applied to the data. The amount of bubble energy in the radial data was unexpected and required a debubble step added to the original processing sequence. It is worth mentioning that the binning steps for the COV (common offset vector) domain with a cell size of 1000 m in a hexagonal grid and we applied Voronoi weights before the final Kirchhoff migration to correct for amplitude variations due to trace fold fluctuation. We did not apply the receiver statics correction to the data. Therefore, we did not update the Vs velocity using such information (since it was not possible to access it in a deep water OBN geometry).
We built the initial Vs model for the tomographic update process as follows:
- Vs measurements at depths of 0-60 m below the seafloor (8 profiles).
- Empirical equation from 60 to 200 m depth below the seafloor (Suarez, 2005).
- Vs volume provided by the asset team for the post-salt after smoothing.
- Vs calculated from Vp using a nearly constant Vp/Vs ratio within the salt.
In Figure 5, there are the Vs measurements from the 8 profiles mentioned in the previous section (lines with dots), compared to the empirical equation (Suarez, 2005) in red.
It is noticeable that, on average, the measured values are lower than those predicted by the equation. However, we did not access the lateral variation of Vs due to the small number of measurements in the pilot area, then an average velocity profile was used for the processing area. The use of lower velocity values in the ultra-shallow part (0-60m) resulted in preliminary seismic sections with a top salt horizon closer to the interpreted horizon from the PP data.
Finally, using the initial Vs described above and the other model parameters (Vp, delta, epsilon, theta, and phi) obtained from PP wave processing, we performed five tomographic inversions to update the Vs model only, as follows:
- Tomography in post-salt sediments.
- Vp/Vs analysis and editing.
- Tomography in post-salt sediments.
- Global tomographic update.
- Intra-salt editing.
- Tomography in the salt and pre-salt regions.
- Final tomography in the pre-salt portion.
The migrated gathers used as input for tomography were split into 6 azimuth sectors, each azimuth corresponding to 60 degrees interval. To improve the continuity of the events for moveout picking, a set of spatial median filters were applied to the data. For the two tomographies aimed at the post-salt sequence, we have selected CRP gathers that are closer to the receiver positions since they have a more homogeneous amplitude distribution of the events.
A FWI algorithm for updating Vs is in development and could not be tested in this project.
Results
After updating the Vs volume in the post-salt, intra-salt, and pre-salt columns, we observed a significant improvement both in the calculated Vp/Vs ratio cube (Figure 7) and in the seismic image of the PS wavefield. The output Vp/Vs ratio shows more details and lateral changes, mainly in the pre-salt portion of the section.
The PS seismic imaging step was performed using an acoustic Kirchhoff algorithm adapted to PS-type conversions. The Kirchhoff algorithm was not modified but we calculated the travel times using Vs for the path between conversion point and receiver position. Figure 8 shows a comparison between a crossline of the migrated PP upgoing section, and the migrated PS section with final filters applied (curvelet domain filtering and structural consistent filtering). In the region of the red circle, there is a good correlation between the events in both sections, including the faults. In the blue circle, there is a strong and coherent signal in the PS section, with structures that are consistent with the PP image. There is also a degradation of the signal below the thicker salt layer.
We tested an RTM imaging algorithm adapted for PS imaging and the preliminary results indicated a major uplift in the imaging of complex structures like salt flanks. However, due to high computational cost, the RTM algorithm could not be applied to the pilot area during the project and results are not included in this paper.
Vs refinement
After having the first Kirchhoff migrated PS cube, the correlation analysis between the PP and PS data in depth indicated that the velocity still showed incorrect values in the shallow part, between 100 and 1000 m below seabed, causing differences in depth of the main post-salt horizons between the two datasets. As the quality of the gathers prevented better updates of the velocity via tomography, we tested a new procedure based on PP-PS registration.
We generated nine perturbed Vs volumes (ranging from 92 to 108 % of the Vs input model) between two shallow horizons, approximately 100 to 1000 metres below the seabed. From the perturbed velocities, we had migrated inlines (every 40 inlines) for each perturbation scenario. We built a new Vs volume from the picked perturbated values that varied laterally. This interpretation in the migrated images was made based on the criteria of highest correlation between the depths of the PP and PS data in the perturbation region. After that, the velocity volume was smoothed and subjected to the tomographic updates from the first model-building workflow, as presented in the previous section.
Sometimes, the correlation between PP and PS amplitude sections is not straightforward since they are affected by the rock properties in different ways. Nevertheless, comparing the migrated volume before and after the refinement routine, we observed improvements in several points of the volume regarding the focus of events. Figure 9 shows improvement in the image just above and below the base of salt horizon mainly in the left portion of the section (arrows) where we have a thicker salt body.
When comparing the Vp/Vs ratio volume (Figure 10), we observed an evolution in terms of layer definition and structural correlation between this property and the main events after the final model refinement.
We performed tests of elastic inversions after the first velocity model-building flow (before the tested refinement) to assess the value of adding the PS data in the process and the results are discussed in Damasceno et al., 2025.
Conclusions
We demonstrated the feasibility of producing geologically consistent PS stack volumes from standard OBN data, even in challenging imaging targets and with the application of conventional adapted tools. We observed that the impact of knowing Vs in the vicinity of the seafloor, where the Vp/Vs ratio is anomalously high, sometimes exceeding values of 10, is significant. The inclusion of information from the measured Vs profiles proved to be crucial in obtaining a consistent PS image. Furthermore, the resulting shear velocity model from this workflow can be used subsequently as an input to more advanced update techniques such as elastic FWI (Bulcão et al., 2023; Cho et al., 2022; Ning et al., 2024) and shallow refraction tomography (Bezerra et al., 2022).
The S-impedance attribute has a great impact on the characterisation of pre-salt reservoirs because it may allow discrimination between lithologies that overlap in the P-impedance, in addition to contributing to the distinction of rock and fluid effects. Adding the PS volumes to the elastic inversion process will significantly improve this petrophysical characterisation of the reservoir zones since we obtain a higher quality S-impedance in terms of resolution, signal-to-noise ratio and well log match (Damasceno et al., 2021, Damasceno et al., 2025).
Acknowledgements
The authors would like to thank Petrobras and partners (CNOOC and CNODC) for giving permission to present this work. The authors acknowledge the asset team in addition to all sectors of Petrobras that made essential contributions to the project.
References
- Ata, E., Olson, R., Mosher, C.C., Shaw, S. and Betterly, S. [2013]. Look at converted waves from an OBN test survey. SEG Technical Program Expanded Abstract, 5170-5174.
- Baziw, E. and Verbeek, G. [2017]. Quality Assessment of Seismic Data Sets and the Impact on Interval Velocity Estimates in DST. Proceedings of the DFI 42nd Annual Conference on Deep Foundations, 598-608.
- Bezerra, M., Simmons, J. and Gaiser, J. [2022]. Seafloor elastic parameters estimation using a regression neural network. Society of Exploration Geophysicists and American Association of Petroleum Geologists, 3671-3675.
- Brando, G., Benjamin, H. and Cypriano, L. [2023]. Imaging the presalt with elastic FWI using OBN data. Third International Meeting for Applied Geoscience and Energy Expanded Abstracts, 685-689.
- Bulcão, A., Almeida, A.C., Dias, B.P., Cortez, C.A.C., Soares, D.M., Alves, G.C., Barros, P.M. and Girardi, T.I. [2023]. Elastic FWI: A study on parametrization and applications of the pseudo-Hessian. Eighteenth International Congress of the Brazilian Geophysical Society, Abstract.
- Casado, N., Carneiro, M., Parekh, C., Barros, P., Igarashi, J. and Castro, C. [2024]. Improved Target Illumination Using High-Frequency Elastic FWI for Santos Basin OBN Surveys. Fourth EAGE Conference on Pre-Salt Reservoir, Extended Abstracts.
- Cho, Y., Solano, C.P., Kimbro, J., Yang, Y., Plessix, R. and Matson, K. [2022]. Influence of shear velocity on elastic full-waveform inversion: Gulf of Mexico case study using multicomponent ocean-bottom node data. Geophysics, 87(5), 391-400.
- Cruz, N., Cruz, J., Teixira, L., Costa, M., Oliveira, L.B., Urasaki, E.N., Bispo, T., Jardim, M., Grochau, M. and Maul, A. [2021]. Tupi Nodes pilot: A successful 4D seismic case for Brazilian presalt reservoirs. The Leading Edge, 40(12), 886-896.
- D’Afonseca, L., Krishnasamy, T., Birkeland, O.J., Guillaume, P., Santiago, T.M.G, Guerra, C. and Lima, R. [2014]. Innovative PSDM processing of OBC data on Albacora field. SEG Technical Program Expanded Abstracts, 1832-1836.
- Damasceno, A., Tura, A. and Simmons, J. [2021]. The added value of joint PP–PS inversion for reservoir characterization: A case study using Jubarte PRM seismic data (offshore Brazil). Geophysical Prospecting, 70(1), 121-134.
- Damasceno, A., Lima, G.R., Rapini, M. and Silva, L.M.T. [2025]. Nodes Acquisitions PS-waves Added Value: Impact of PS-stacks on Elastic Inversion for a Brazilian Pre-Salt Reservoir. 86th EAGE Annual Conference & Exhibition (including the Workshop Programme), Extended Abstracts.
- Davydenko, M. and Verschuur, D. [2016]. Optimal imaging of OBN data using all multiples. SEG Technical Program Expanded Abstract, 4230-4234.
- Formigli, J. [2008]. Santos Basin Pre-Salt Cluster: How to Make Production Development Technical and Economically Feasible. Rio Oil and Gas Conference, Abstract.
- Gaiser, J. [2016]. 3C Seismic and VSP: Converted waves and vector wavefield applications. SEG Distinguished Instructor Short Course, 155-200.
- Jouno, F., Martinez, A., Ferreira, D., Donno, D. and Khalil, A. [2019]. Illuminating Santos Basin’s pre-salt with OBN data: Potential and challenges of FWI. SEG Technical Program Expanded Abstract, 1345-1350.
- Ning, I., Tan, J. and Dash, R. [2024]. Sparse ocean bottom node seismic interferometry and inversion: A Gulf of Mexico study. Fourth International Meeting for Applied Geoscience & Energy, 1830- 1834.
- Ristow, J., Lanznaster, D. and Jouno, F. [2024]. Advances in OBN Imaging for Pre-Salt Fields. 85th EAGE Annual Conference and Exhibition, Extended Abstracts.
- Rodriguez-Suarez, C. [2005]. Sea-bottom shear-wave velocities and mode conversions. Revista Brasileira de Geofísica, 23(1), 75-87.
- Zhigang, Z., Mei, J., Lin, F., Huang, R. and WangZhang, P. [2018]. Correcting for salt misinterpretation with full-waveform inversion. SEG Technical Program Expanded Abstracts, 1143-1147.

